Record Tests
Chrome DevTools has a Recorder panel that allows users to record and playback automated steps within Chrome. These steps can be exported into WebdriverIO tests with an extension making writing test very easy.
What is Chrome DevTools Recorder
The Chrome DevTools Recorder is a tool which allows you to record and replay test actions directly in the browser and also export them as JSON (or export them in e2e test), as well as measure test performance.
The tool is straightforward, and since it’s plugged into the browser, we have the convenience of not switching the context or dealing with any third-party tool.
How to Record a Test with Chrome DevTools Recorder
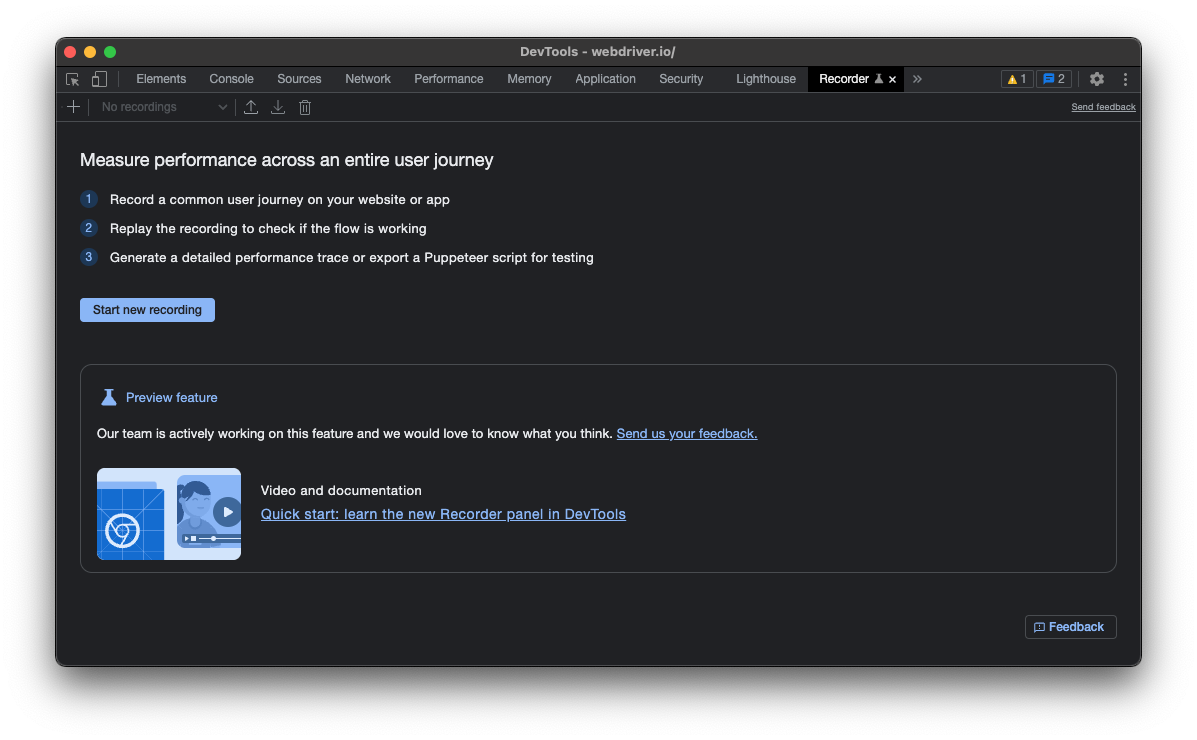
If you have the latest Chrome you will have the Recorder already installed and available for you. Just open any website, do a Right-Click and select "Inspect". Within DevTools you can open the Recorder by pressing CMD/Control + Shift + p and enter "Show Recorder".

To start recording a user journey, click on "Start new recording", give your test a name and then use the browser to record your test:

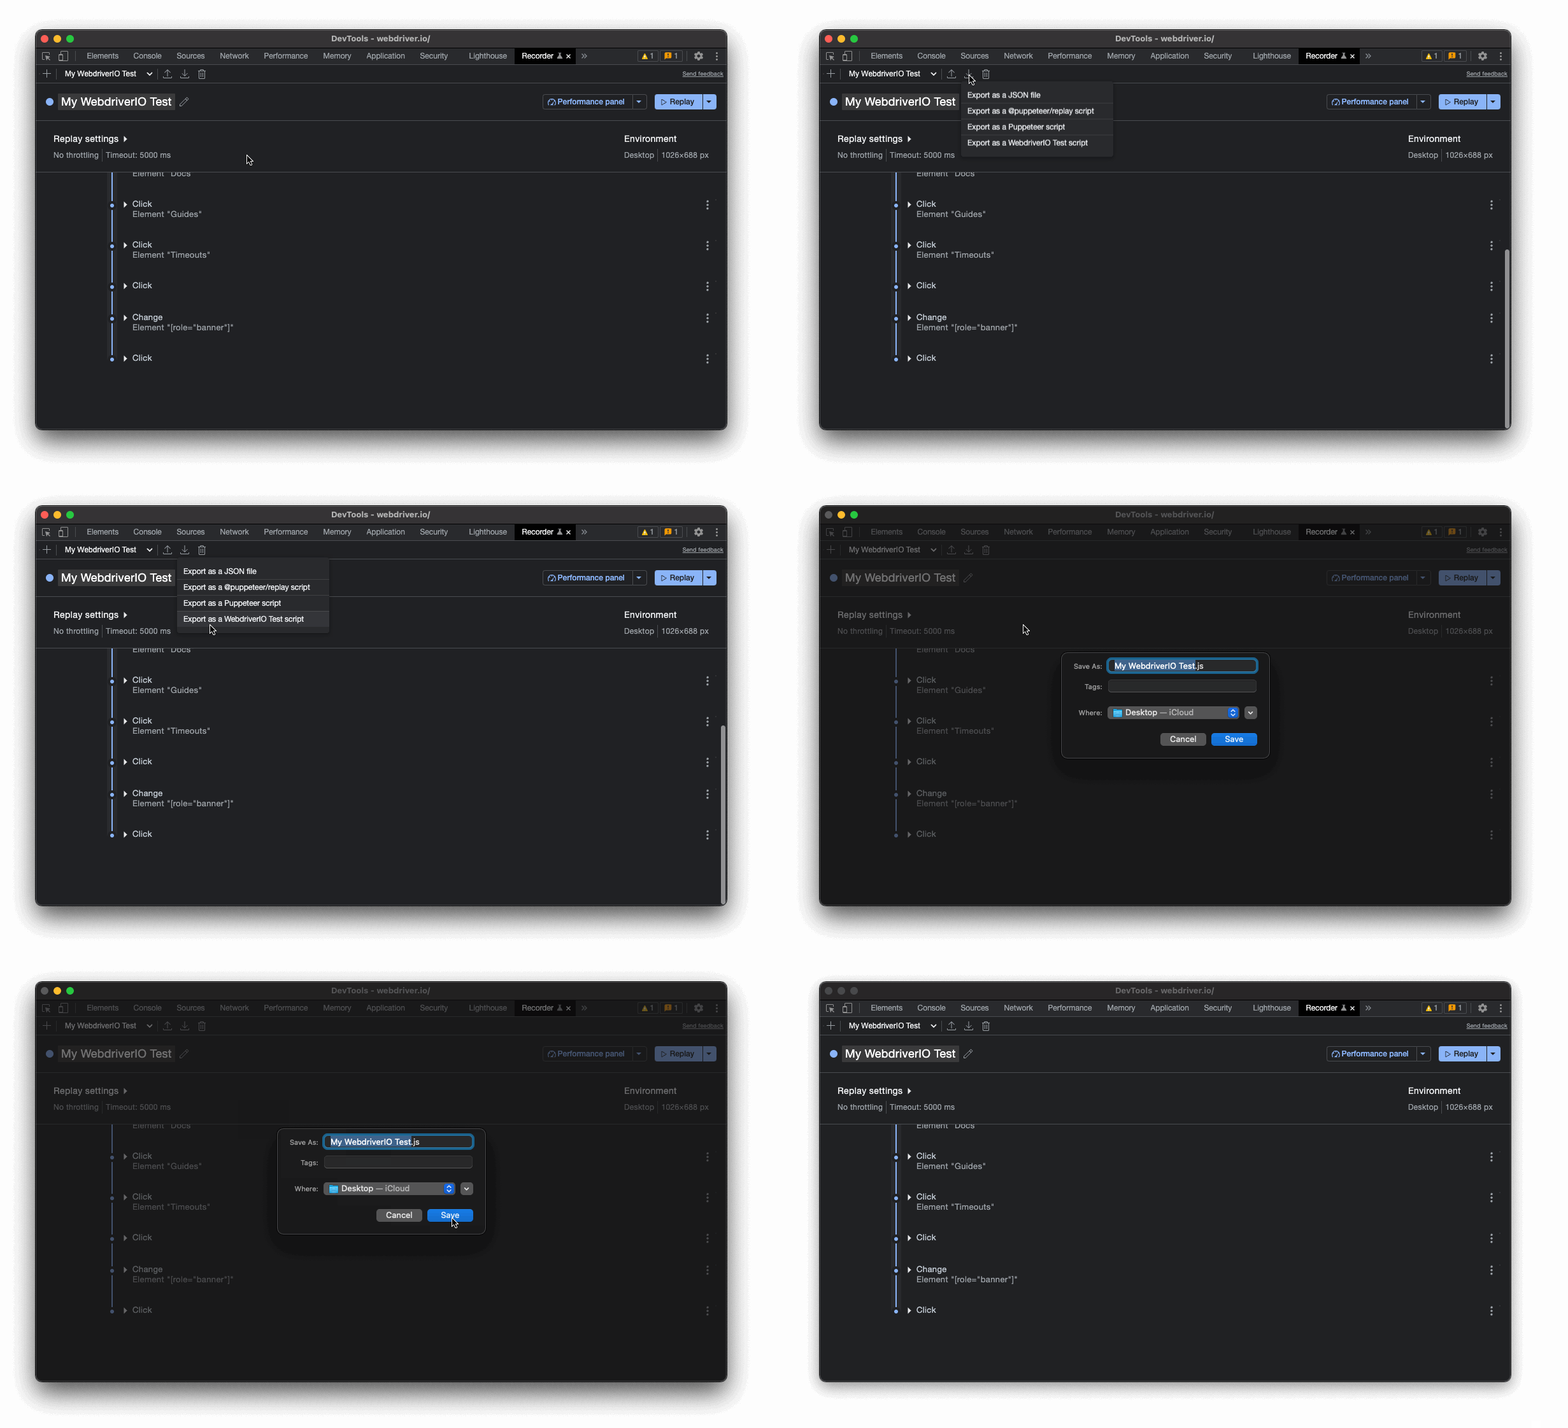
Next step, click on "Replay" to check if the recording was successful and does what you wanted to do. If everything is ok, click on the export icon and select "Export as a WebdriverIO Test Script":
The "Export as a WebdriverIO Test Script" option only available if you install the WebdriverIO Chrome Recorder extension.

That's it!
Export Recording
If you exported the flow as WebdriverIO test script, it should download script that you can copy&paste in your test suite. For example the above recording looks as follows:
describe("My WebdriverIO Test", function () {
  it("tests My WebdriverIO Test", function () {
    await browser.setWindowSize(1026, 688)
    await browser.url("https://webdriver.io/")
    await browser.$("#__docusaurus > div.main-wrapper > header > div").click()
    await browser.$("#__docusaurus > nav > div.navbar__inner > div:nth-child(1) > a:nth-child(3)").click()rec
    await browser.$("#__docusaurus > div.main-wrapper.docs-wrapper.docs-doc-page > div > aside > div > nav > ul > li:nth-child(4) > div > a").click()
    await browser.$("#__docusaurus > div.main-wrapper.docs-wrapper.docs-doc-page > div > aside > div > nav > ul > li:nth-child(4) > ul > li:nth-child(2) > a").click()
    await browser.$("#__docusaurus > nav > div.navbar__inner > div.navbar__items.navbar__items--right > div.searchBox_qEbK > button > span.DocSearch-Button-Container > span").click()
    await browser.$("#docsearch-input").setValue("click")
    await browser.$("#docsearch-item-0 > a > div > div.DocSearch-Hit-content-wrapper > span").click()
  });
});
Make sure you revisit some of the locators and replace them with more resilient selector types one if necessary. You can also export the flow as JSON file and use the @wdio/chrome-recorder package to transform it into an actual test script.
Next Steps
You can use this flow to easily create tests for your applications. The Chrome DevTools Recorder has various additional features, e.g.:
Make sure to check out their docs.